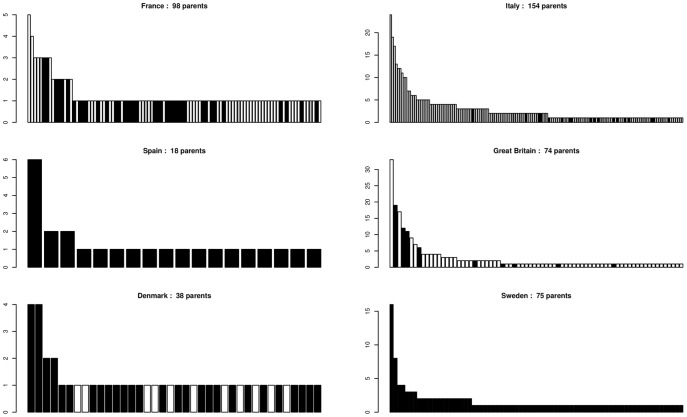
Figure 4. Variation of the relative reproductive success of trees.
The number of different parents assigned after parentage analysis is given for each stand. In each stand, each bar is a parent, parents are ordered by decreasing reproductive success, bar height represents the percentage of the total number of seedling for which the considered individual is the parent. □ Quercus petraea ▪ Quercus robur
 Undetermined species.

