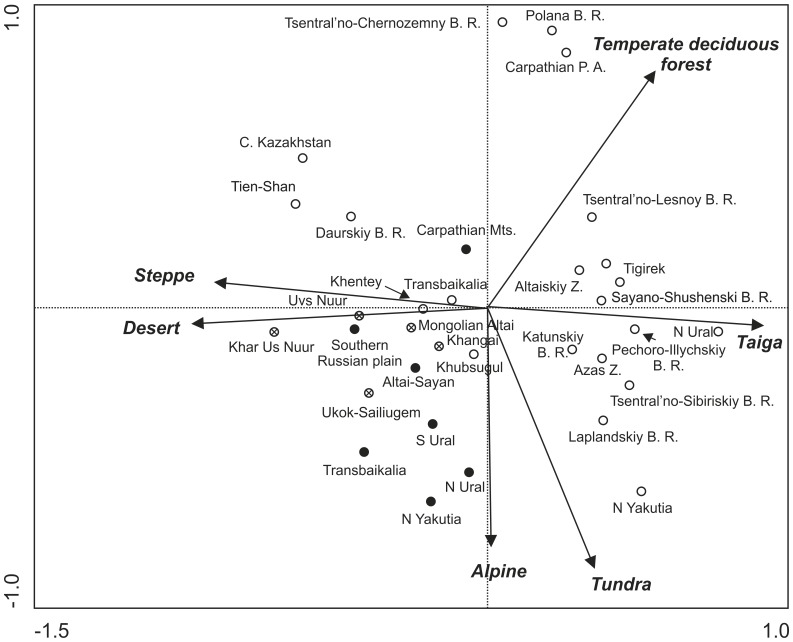
Figure 3. Projection scores of mammalian communities for studied localities (PCA).
Species were classified according to their presence in a particular biome. The first two axes describe 89.8% of variance. Open circles – Recent assemblages; crossed circles – Recent eastern Altai assemblages; full circles – Last Glacial assemblages

