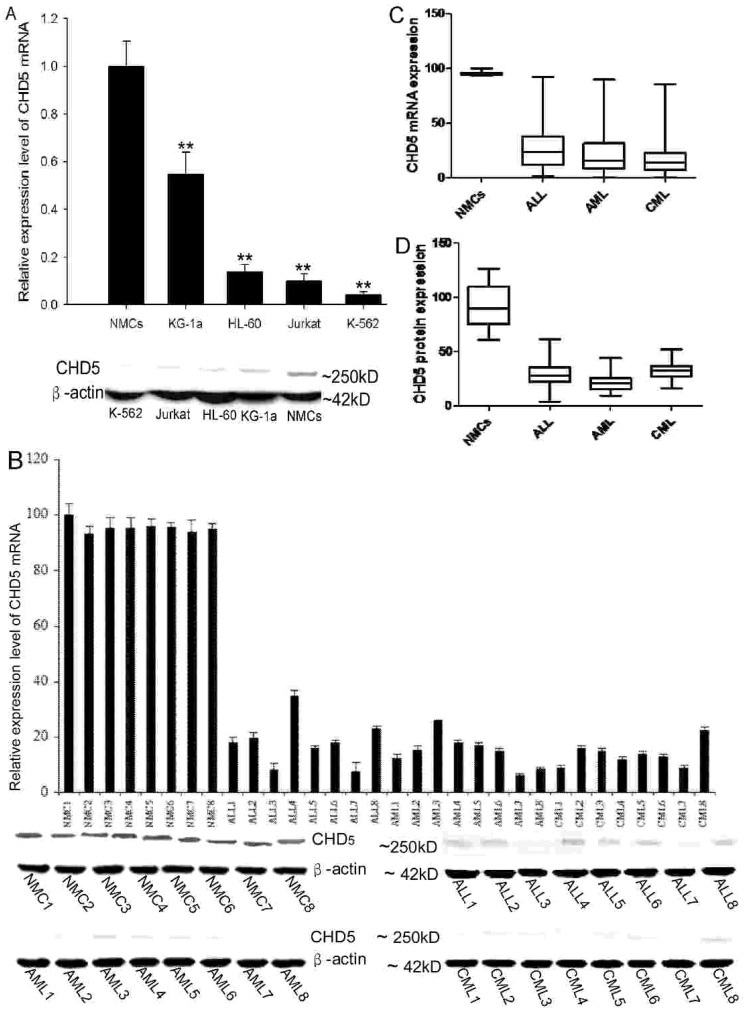
Figure 1. CHD5 expression is down-regulated in leukemia cell lines and samples.
CHD5 expression was determined for K-562, KG-1a, HL-60 and Jurkat cell lines by qRT-PCR (top) and western blotting (bottom) (A). Representative results of CHD5 mRNA (top) and protein (bottom) expression from ALL, AML and CML patients are presented (B). The distribution of CHD5 mRNA (C) and protein level (D) in ALL, AML and CML samples and NMCs (included for comparison) were calculated. For all experiments, β-actin was detected as an internal control. All data are presented as mean ± SD. P<0.001 was considered statistically significant (**).

