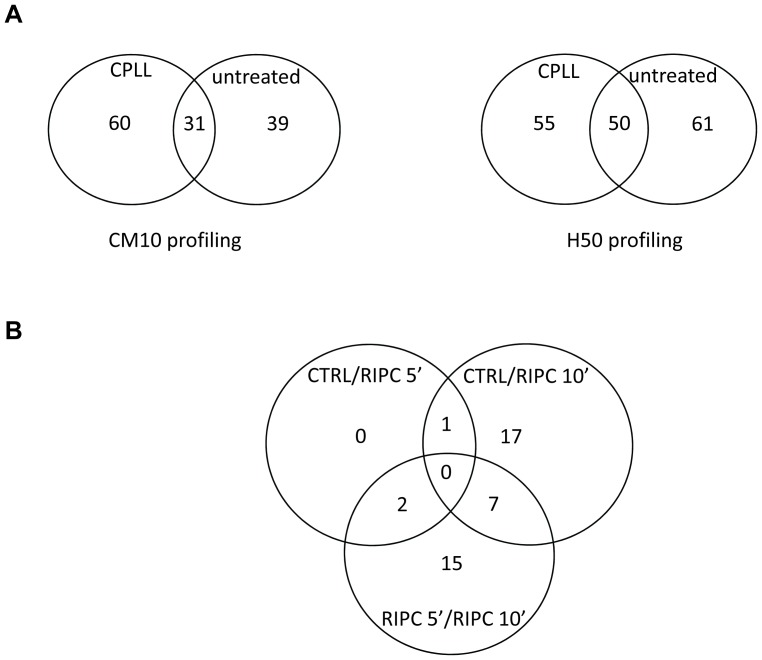
Figure 1. Venn diagram demonstrating the number of SELDI peaks detected and analysed for the comparison between the CRTL, RIPC 5′ and RIPC 10′ groups.
A: Comparison of the number of peaks detected before or after CPLL treatment of plasma samples in CM10 and H50 arrays. B: Comparison of the number of peaks with significant modulations of intensity in the CRTL, RIPC 5′ and RIPC 10′. All the samples were analyzed in duplicate.

