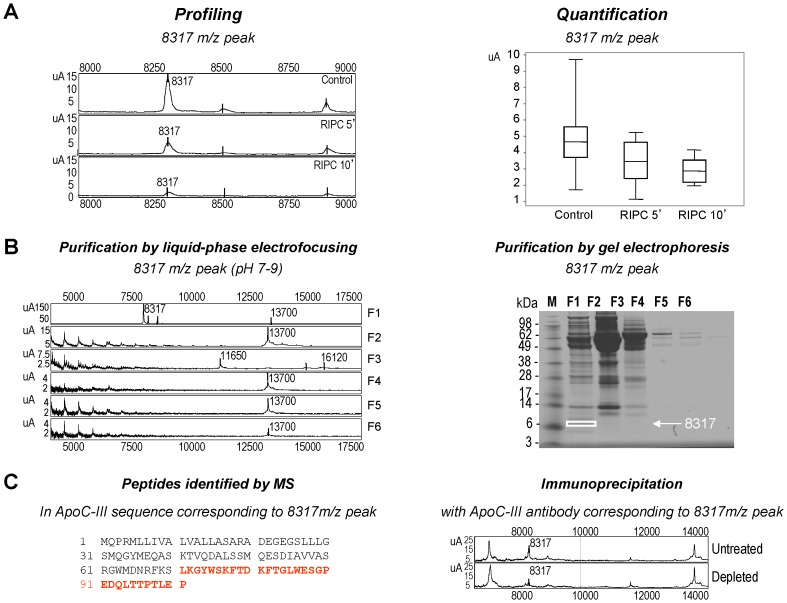
Figure 2. Profiling, purification and identification of the protein corresponding to the 8317 m/z peak.
A: Representative SELDI-TOF-MS protein spectra of plasma sample from one Control, one RIPC 5′, and one RIPC 10′ rat. Results are presented as intensities of SELDI-TOF reading (arbitrary units). The 8317 m/z peak was found to be differentially expressed on the CM10 array as calculated by the Mann-Whitney test (left panel). Scattergram showing the significant differences in intensity of 8317 m/z peak in plasma samples derived from Control, RIPC 5′, and RIPC 10′ rats. The continuous line represents the mean, and dots represent each individual rat (n = 10 in each group) (right panel). Detailed p-value data for comparison between the three groups is indicated in Table 2. B: Purification of the protein corresponding to the 8317 m/z peak. SELDI-TOF-MS protein spectrum of fractions F1, F2, F3, F4, F5 and F6 from MicroRotofor® cell, by a pH gradient 7–9 (left panel). Each fraction (F1, F2, F3, F4, F5 and F6) was analyzed on NU-PAGE 10% coomassie blue stained-gel. The band corresponding to the 8317 m/z peak was framed (right panel). C: Identification of the 8317 m/z peak by mass spectrometry. Aminoacids indicated in red corresponds to the peptides identified in Apolipoprotein C-III (ApoC-III) (left panel). SELDI-TOF-MS protein spectra of crude (untreated) and immunodepleted plasma (20 µL) with 10 µg ApoC-III antibody (depleted) showed the decrease in 8317 m/z peak following immunodepletion, validating the identification (right panel).

