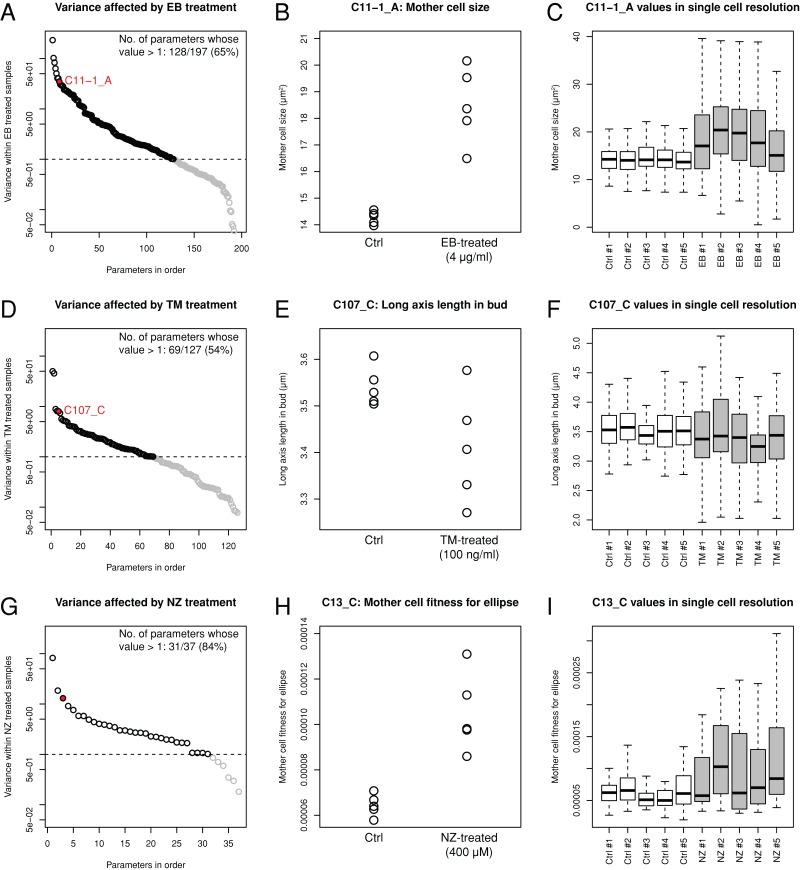
FIGURE 4:
Marked morphological variation among drug-treated yeast populations. (A, D, G) Variance in the morphological parameters affected by the drugs (A, EB; D, TM; and G, NZ) was plotted in the highest to lowest order. Black and gray circles indicate parameters of higher and lower variance compared with the control (=1, dashed line), respectively. Red circles denote morphological parameters exemplified in B, E, and H. (B, E, H) Examples of morphological parameters with increased variance upon EB, TM, and NZ treatment. (C, F, I) Distributions of morphological parameters exemplified in B, E, and H visualized using a box plot with single-cell resolution. Gray and white boxes denote single-cell distribution with and without drug treatment, respectively.

