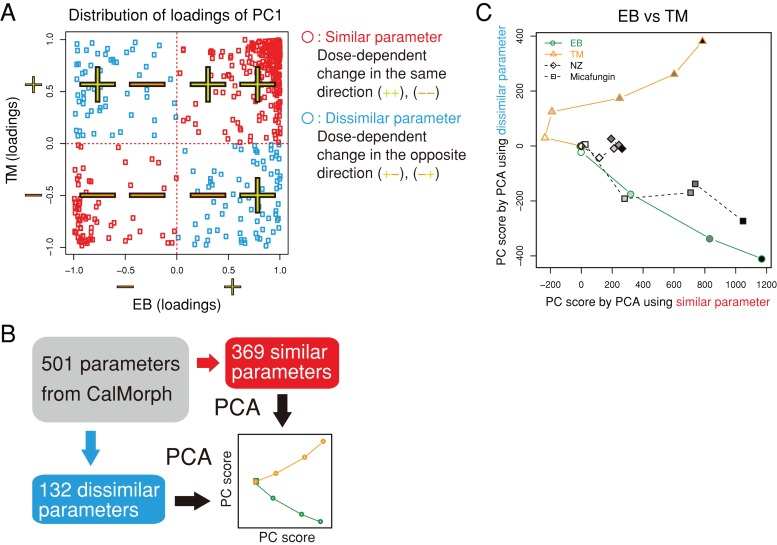
FIGURE 5:
Similarity and dissimilarity of the effects of the drugs on cell morphology. (A) Distribution of loadings for PC1 after PCA of the EB and TM data. Of the 501 parameters, 369 were defined as similar (red symbols) due to their distribution in the first/third quadrants; otherwise, 132 were dissimilar parameters that were distributed in the second/fourth quadrants (blue symbols). (B) Schematic representation of the extraction of similar/dissimilar effects on drug treatment. Morphological parameters were assigned to similar or dissimilar parameters based on the loading sign and independently subjected to the second PCA. Dose-dependent effects of the drugs were then visualized in a similar/dissimilar 2D space. (C) Similar and dissimilar effects of EB and TM on cell morphology. Morphological changes induced by NZ and micafungin were mapped onto the 2D space. The grayscale indicates the doses of drugs used (from dilute to concentrated).

