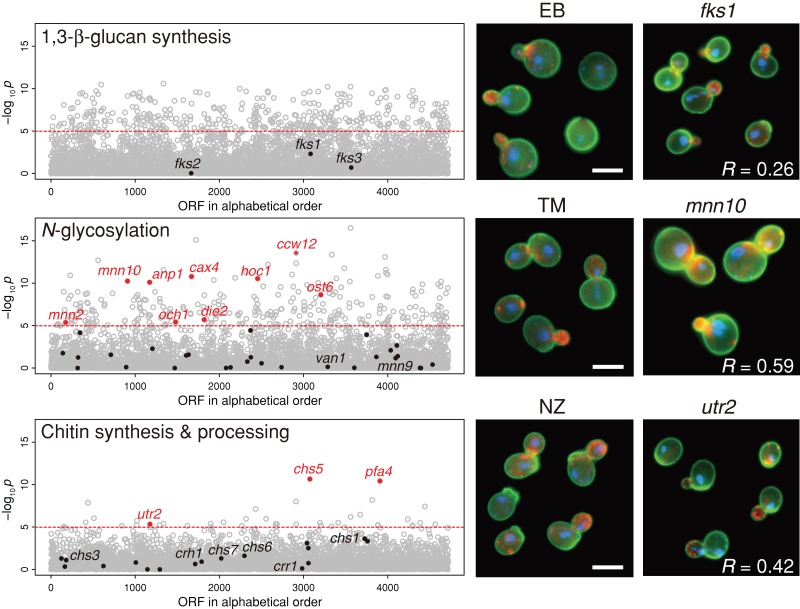
FIGURE 6:
Morphological profiling of the cell wall–affecting drugs. The drug-induced morphological profiles were compared with 4718 mutants of nonessential genes, as described previously (Ohnuki et al., 2010). The vertical axis indicates the similarity to each gene deletion mutant as a –log10 p value of a correlation coefficient (t test). The horizontal dashed line shows the threshold of p = 1.06 × 10⁻⁵ corresponding to a one-sided p = 0.05 after Bonferroni correction. Red dots denote cell wall–associated mutants (Lesage and Bussey, 2006; Orlean, 2012), with morphological profiles similar to those of drug-treated cells. Right, representative photographs of wild-type cells after drug treatment and representative deletion mutants (fks1, mnn10, and utr2). R is the correlation coefficient between drug-treated and mutant cells. Bar, 5 μm.

