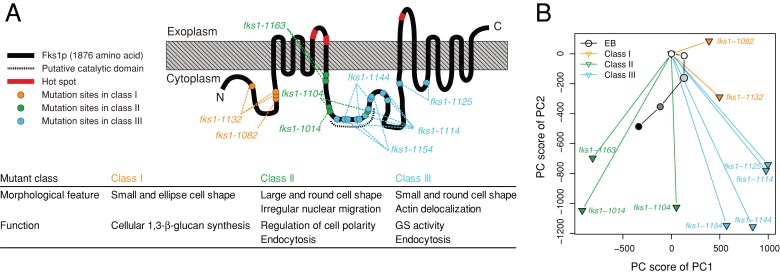
FIGURE 7:
Morphological phenotypes of EB-treated and fks1 cells. (A) Functional map of Fks1p (modified from Okada et al., 2010). The gray-hatched box denotes the plasma membrane. Red symbols on the black line indicate hot spots (the echinocandin resistance–conferring mutations). The amino acids mutated and the hot spots are listed in Supplemental Table S6. (B) PCA of the data sets of EB-treated and fks1 cells. Morphological data on EB-treated cells were mapped onto the 2D space obtained by PCA of the fks1-ts mutant (Okada et al., 2010). The grayscale within the circular symbols indicates the dose of EB used (from dilute to concentrated). PC1 and PC2 explained ∼60% of the variance.

