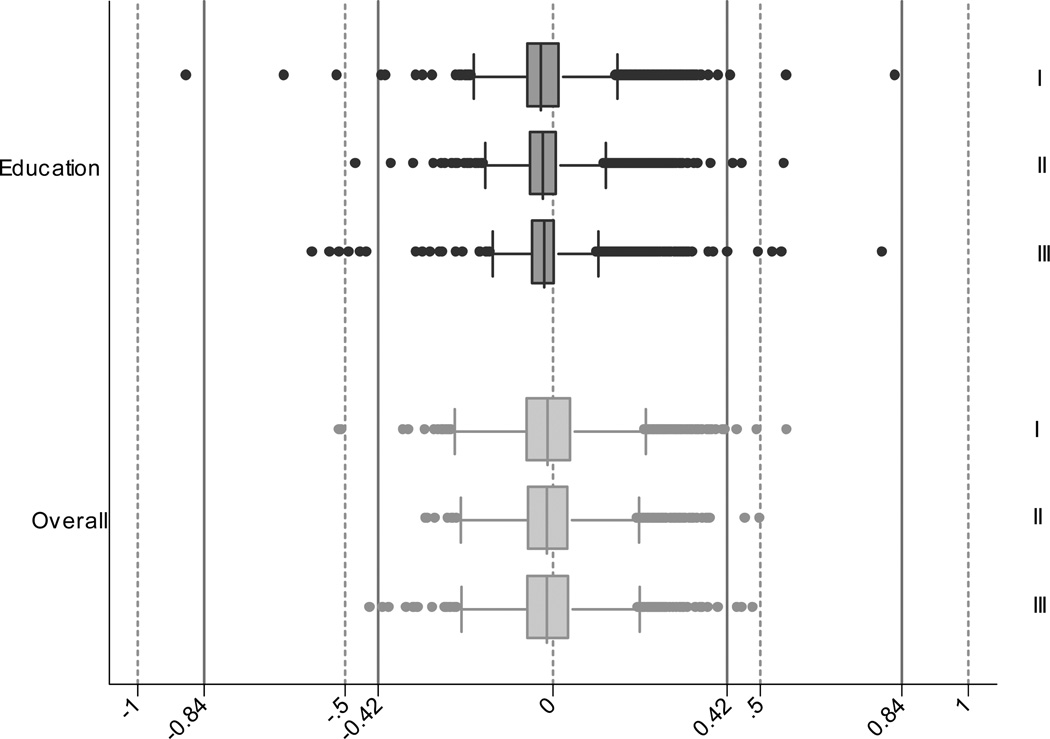
Figure 3.
Cross-sectional DIF impact for English speakers using estimates from longitudinal analysis. In this box-whiskers plot, the box indicates the inter quartile range (IQR), while the whiskers indicate the upper and lower adjacent values as defined by Tukey (Tukey, 1977). Outliers (observations more extreme than the upper and lower adjacent values) are represented by dots. The graph shows the difference between ability estimates accounting for DIF for each covariate (and overall) and unadjusted ability estimates. If DIF had no impact for an individual, that observation should lie at zero. The plots are presented in order: I (baseline for “entire” dataset), II (2nd visit for “entire” dataset) and III (3rd visit for “entire” dataset). Vertical reference lines are placed at ±0.42 to indicate the presence of ‘salient’ DIF. 0.42 was the median of the standard error for the unadjusted ability estimate at baseline for the “entire” dataset.

