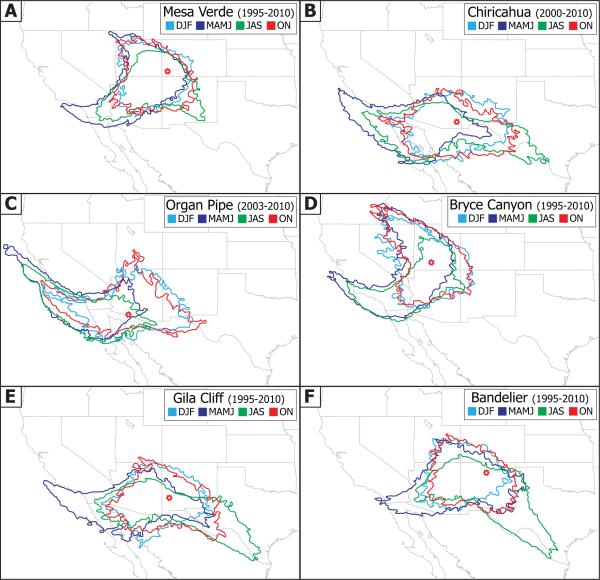
Fig. 2.
Seasonal HYSPLIT data showing the approximate source regions for air parcels ending 10 m AGL at each of the six study sites that are represented by red open markers. The colored borders represent a minimum trajectory frequency of 1 % using three-day back-trajectory data, where frequency is defined as the sum of the number of trajectories that passed through each point on the map divided by the number of trajectories analyzed.

