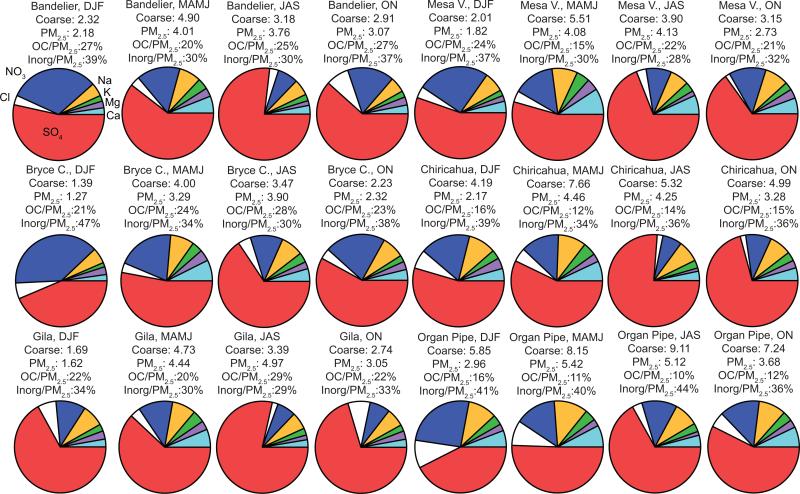
Fig. 5.
Average monthly mass fractions of selected PM2.5 constituents for all six IMPROVE sites and for four seasons. The labels for each color in the top left pie are the same for the other pies. Also reported are average PM2.5 and coarse aerosol concentrations in units of μg m–3, the concentration ratio of OC to PM2.5, and the concentration ratio of the sum of the seven inorganic components of the pies (”Inorg”) relative to PM2.5. These results are based on data ranges in Table 1 for each site.

