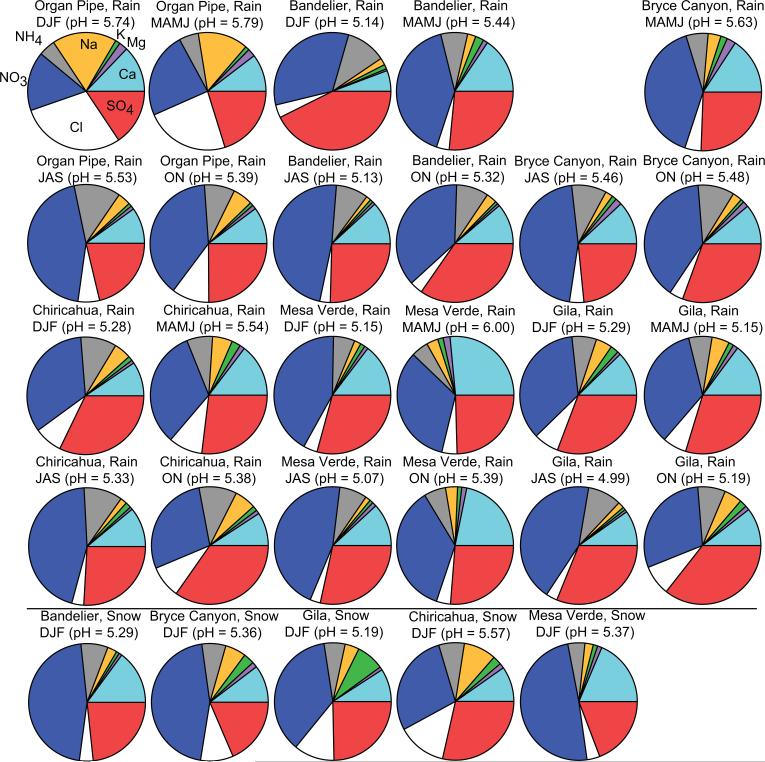
Fig. 9.
(Top four rows) Summary of pH and chemical mass fraction data for rain during different periods of the year. (Bottom row) Snow pH and chemical mass fraction data for DJF, which is the season with the most snow data available. The labels in the top left pie are the same for the other pies. Note that during DJF there is no rain data for Bryce Canyon or snow data for Organ Pipe.

