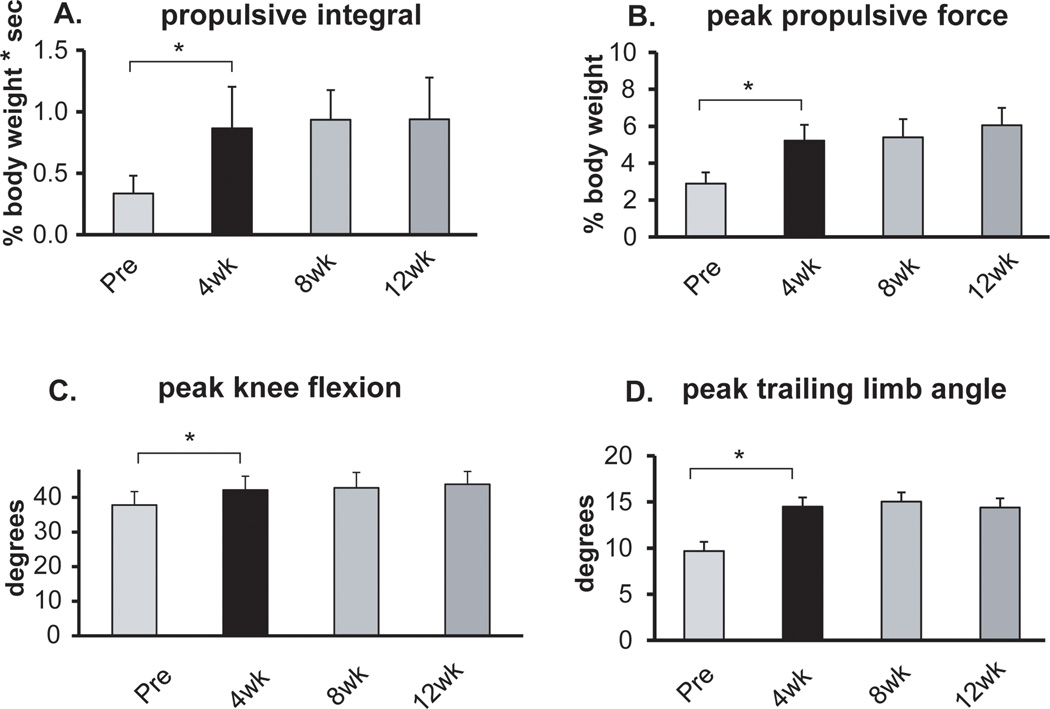
Figure 1.
Results for the targeted kinematic and kinetic variables at self-selected walking speed. From left to right, the bars in each figure represent the average results across participants prior to training (Pre) and after 4, 8 and 12 weeks of training. Error bars are 1 SE. * indicates p<0.05 between time points.

