
Fig. 2.
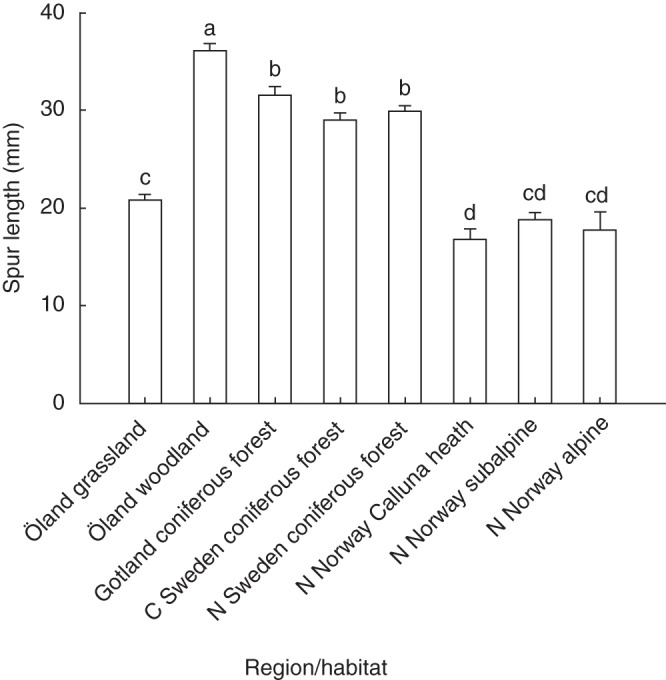
Spur length of Platanthera bifolia in different regions/habitats (± SE; least squares means extracted from mixed-model ANOVA). Different letters indicate statistically significant differences (Tukey–Kramer HSD test, P < 0·05).
Official websites use .gov
A
.gov website belongs to an official
government organization in the United States.
Secure .gov websites use HTTPS
A lock (
) or https:// means you've safely
connected to the .gov website. Share sensitive
information only on official, secure websites.
Spur length of Platanthera bifolia in different regions/habitats (± SE; least squares means extracted from mixed-model ANOVA). Different letters indicate statistically significant differences (Tukey–Kramer HSD test, P < 0·05).