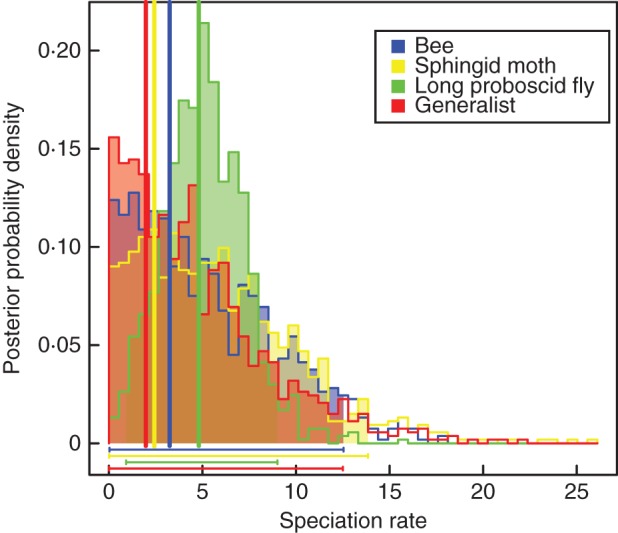
Fig. 5.

MUSSE reconstructions of the pollination syndromes inferred for genus Lapeirousia. The vertical lines represent ML estimations for each type and the horizontal lines represent the 95 % confidence intervals of speciation rate densities for each state.
