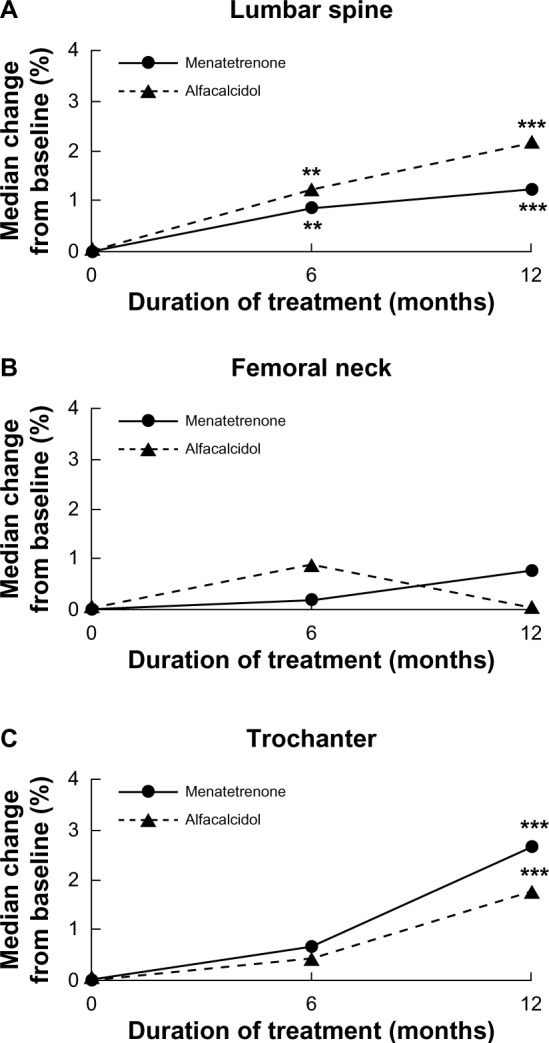
Figure 1.

Median percentage of change over time in bone mineral density. Results are shown for bone mineral density at the (A) lumbar spine, (B) femoral neck, and (C) trochanter.
Notes: **P<0.01; ***P<0.001 compared to baseline. There were no differences between Group M and Group A.
