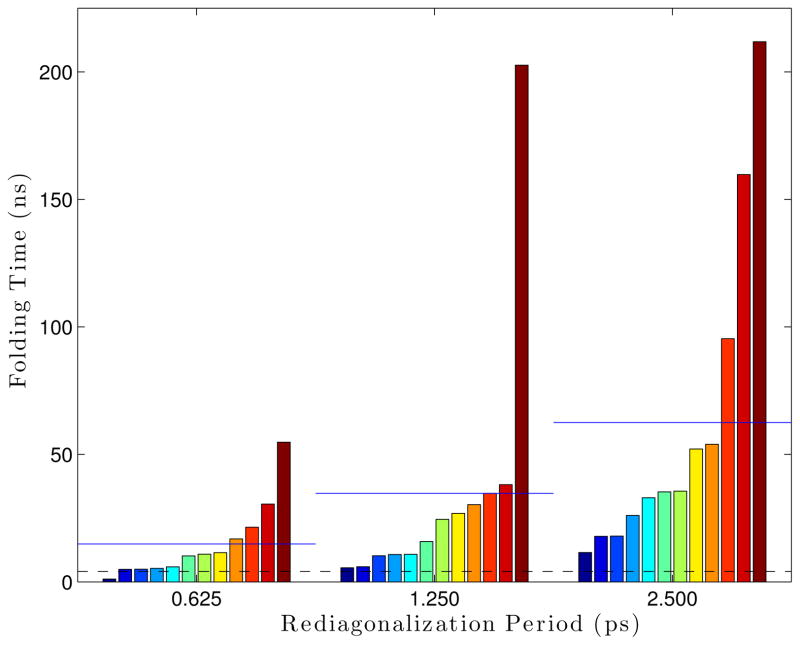
Figure 8.
Rediagonalization period’s effect on the folding time using 12 modes. Each bar is a single simulation, where all bars within a group all use the same parameters. The groups are sorted within themselves. The blue lines drawn over each set of bars are the average folding time for that set, while the dashed black line gives the “reference” folding time from Langevin simulations.

