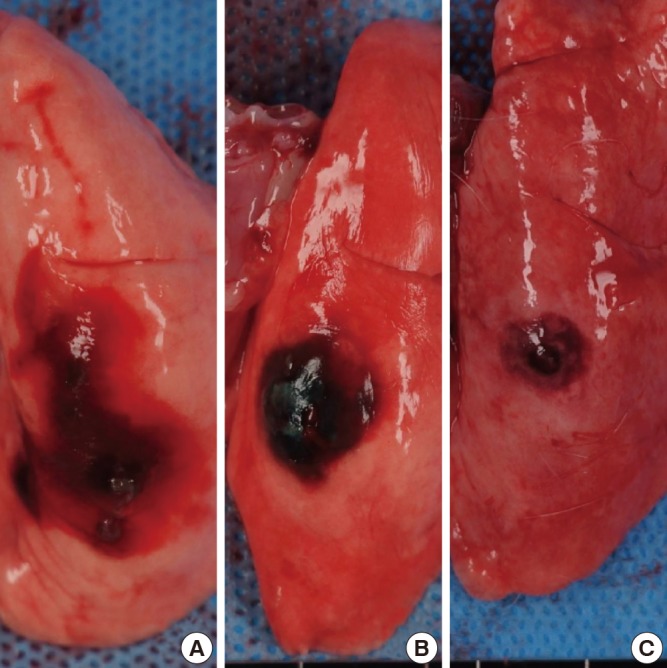
Fig. 2.

Examples of evaluation of staining on the lung surface. Photographs show (A) the extensive staining (score 1), (B) localized dispersion of staining (score 2), and (C) minimal dispersion of staining (score 3). The white lines on the bottom of the figure are markings of the ruler. The distance between two lines is one centimeter.
