
Fig. 3.
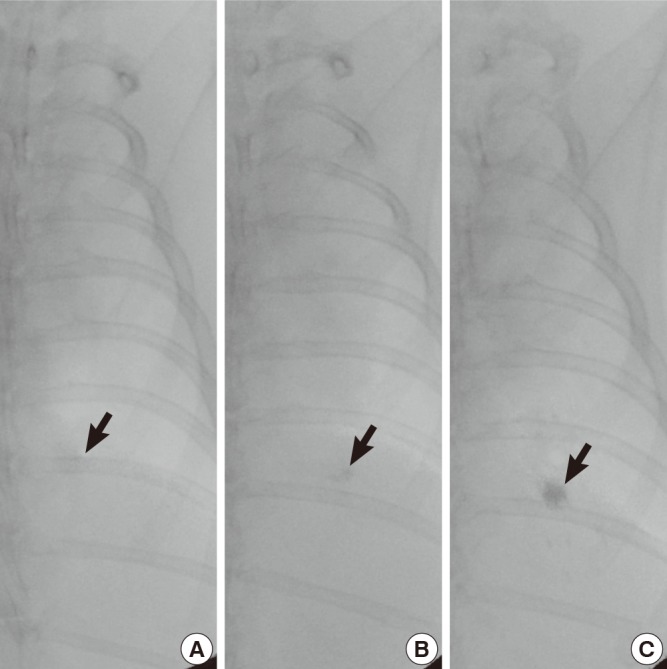
Examples of assessment of radio-opacity on the fluoroscopic examinations. The fluoroscopic images show (A) a minimally increased opacity (arrow) (score 1), (B) a low density of increased opacity (arrow) (score 2), and (C) a compact nodular increased opacity (arrow) (score 3).