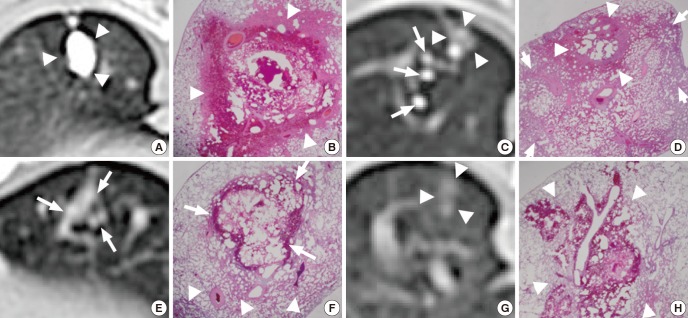
Fig. 4.
CT and corresponding photomicrograph of lung specimen. MLM in Group B (A-D); (A) discrete and compact nodular opacity (arrowheads), (B) focal neutrophil infiltration, necrosis, and hemorrhage (arrowheads) (H&E, ×12.5), (C) scattered small nodular opacities of lipiodol (long arrows) and faint nodular opacity (arrowheads), (D) focal hemorrhage and necrosis (arrowheads) with diffuse neutrophil infiltration (short arrows) (H&E, ×12.5). MLM in Group A (E, F); (E) faint nodular lipiodol opacity (arrows), (F) focal hemorrhage (arrows) with diffuse neutrophil infiltration (arrowheads) (H&E, ×12.5). Methylene blue in Group A (G, H); (G) faint nodular opacity (arrowheads), and (H) focal extent of neutrophil infiltration, necrosis and hemorrhage (arrowheads) (H&E, ×12.5).

