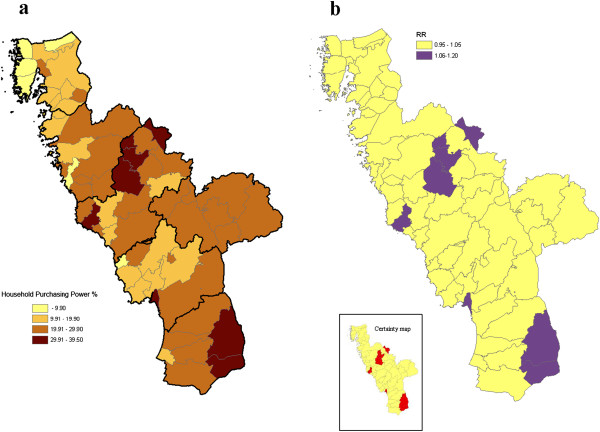
Figure 1.
Geo-map of neighbourhood household purchasing power. The residential areas (parishes) were classified into < 10%, 10–19%, 20–29% and ≥ 30% based on this indicator [according to the Swedish standard, corresponding to ≤ USD 19,500 annual household purchasing power among all resident families with at least one child (≤ 19 years old: family with the same residential address)]. Neighbourhood household purchasing power was defined as total family disposable income adjusted for the composition of the family (number of adults and children). (b) The corresponding geo-map, based on the grouping of the parishes according to neighbourhood-level purchasing power (a), for relative risks of discontinuing breast-feeding at four months of age, denoted RRi for group i, with adjustments for the individual-level variables of maternal age, smoking and parental level of education. Moreover, the accompanying statistical certainty map is shown; neighbourhood household purchasing power areas with a posterior probability of an elevated RRi [Pr (RRi > 1|data)] above 95% coloured in red.

