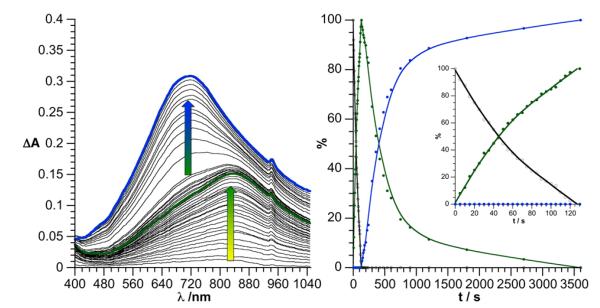
Figure 1.
Left: evolution of the differential visible absorption spectrum of a solution of DSi[Ir] (0.2 mM) in DMF containing NEt3 (1 M) during photoirradiation under visible light (green t = 130 sec., blue t = 1 hour). For clarity purpose, the blank corresponds to the absorption of the initially yellow solution before photolysis. Right: distribution of the different reduction states of DSi[Ir] during the photolysis. Legend: non-reduced DSi[Ir] (colorless circle), 1e−-DSi[Ir] (green circle) and 2e−-DSi[Ir] (blue circles).

