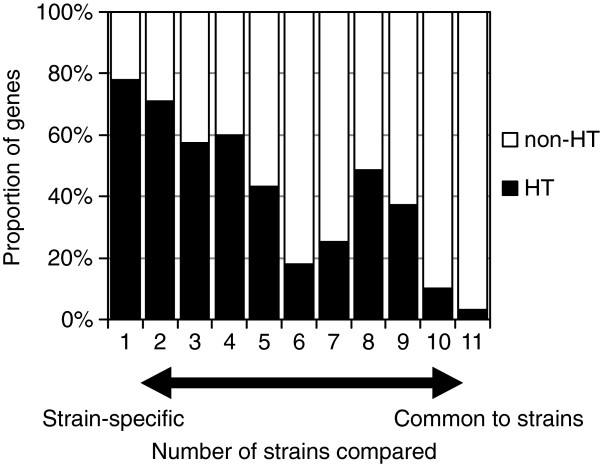
Figure 3.
Distribution of horizontally transferred genes specific/common to E. tarda strains. The black bars indicate the proportions of horizontally transferred (HT) genes. The one at ‘11’ indicates the proportion of HT genes out of the genes common to all the strains. The one at ‘1’ indicates the proportion of HT genes out of the strain-specific genes.

