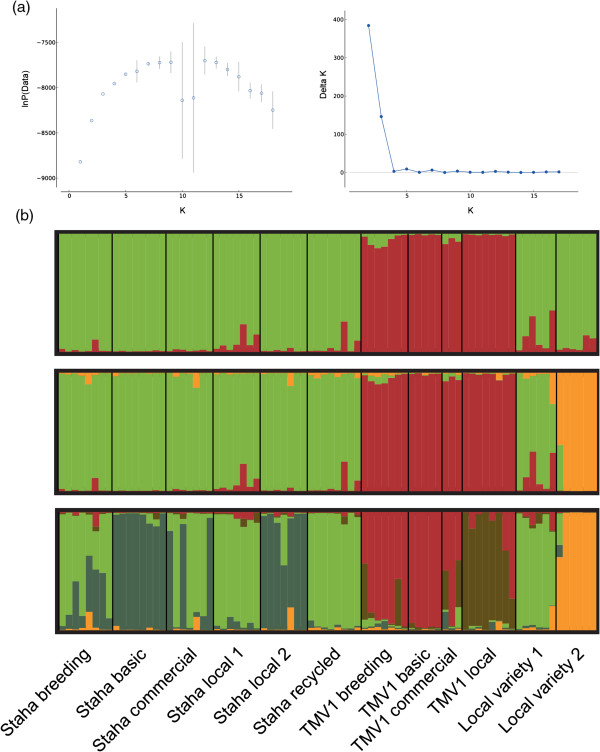
Figure 1.
Population structure in the OPV Staha and local varieties of maize in Mangae, Morogoro. (a) Left hand side: Mean Ln probability of the data for 10 runs for each value of K from 1 to 18, with standard deviations. Right hand side: Plot of Evanno’s delta K for each value of K(b) Structure plots of the assignment probabilities in different samples of OPVs. Each sample is represented by a bar. The plots are based on the highest probability run for K = 2, 3 and 5, respectively (from the top to the bottom).

