
Figure 2.
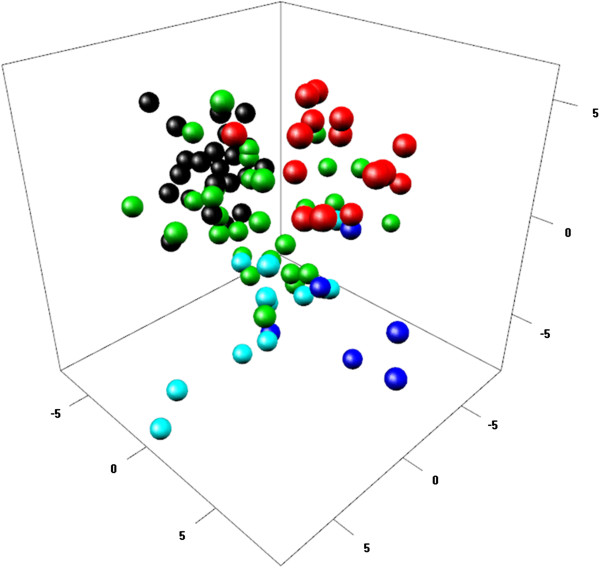
Genetic structure of the OPVs TMV1 and Staha in context of an African maize panel. PCA plot (three first components) of Staha and TMV1 in the context of a panel of African maize: Staha (black); TMV1 (red); East Africa (green); West Africa (blue); Sahel (turquoise).