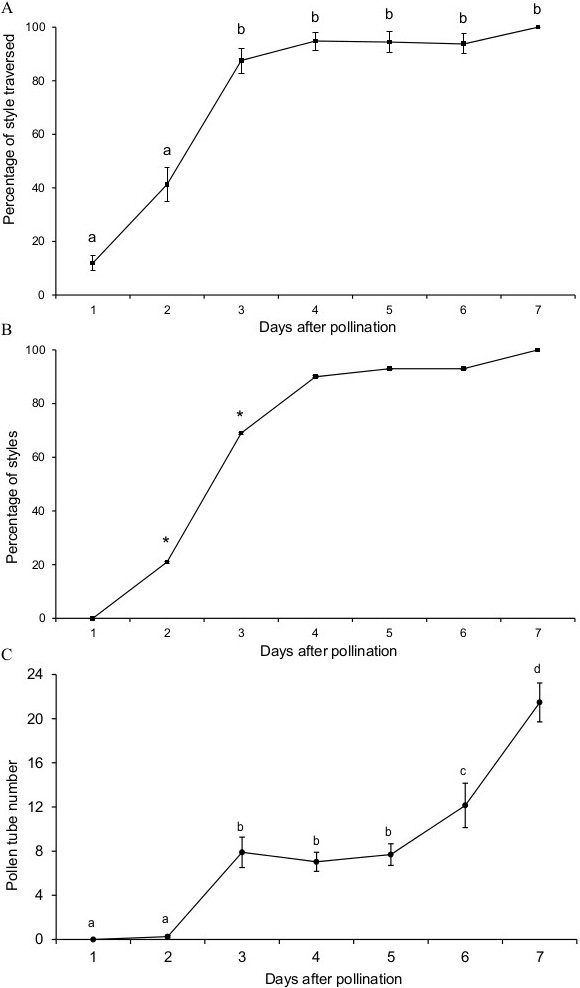
Figure 2.

Pollen tube growth rate in the apple style. (A) Percentage of the style traversed by the longest pollen tube. (B) Percentage of styles with pollen tubes at their base. (C) Mean number of pollen tubes at the style base. Letters over points are independent significant groups separated by Duncan multiple range test at a p?≤?0.05. Asterisks represent significant dependence between day after pollination and the percentage of style traversed with chi-square homogeneity test at a p?≤?0.05.
