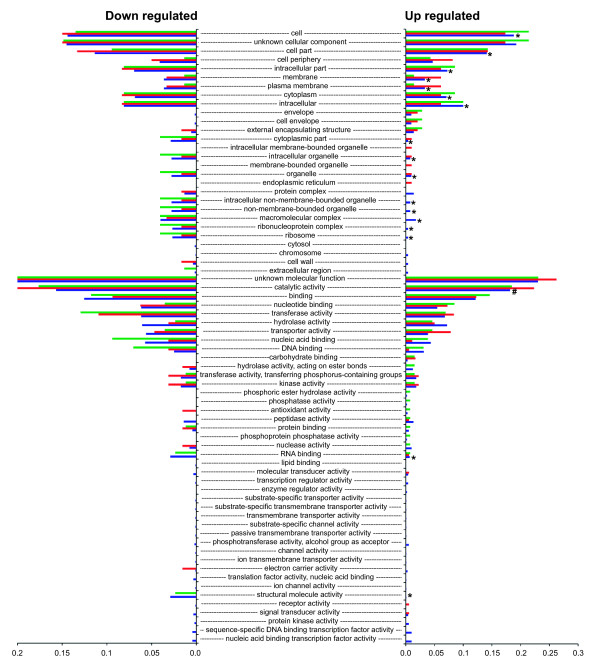
Figure 3.
Proportion of each of the GO Slim molecular function and cellular component terms assigned to genes showing differential expression. From the top of the chart, the first 28 terms are cellular component. Green = FSL S3-586 (bovine sourced isolate), red = NEM316, blue = CCUG 37738 (human sourced isolate). Right side of the chart shows proportions for terms assigned to genes that showed significantly more expression in milk compared to broth (up regulated). Left side of the chart shows proportions for terms assigned to genes that showed significantly more expression in broth compared to milk (down regulated in milk). An asterisk shows terms for the human isolate that were significantly underrepresented for up regulated genes when compared to down regulated genes. The # symbol shows a single term for the human isolate that was significantly over represented for up regulated genes (FDR correction of 0.05). Note: the x-axis scale for down regulated genes ends at 0.2, whereas the scale for the up regulated genes ends at 0.3.

