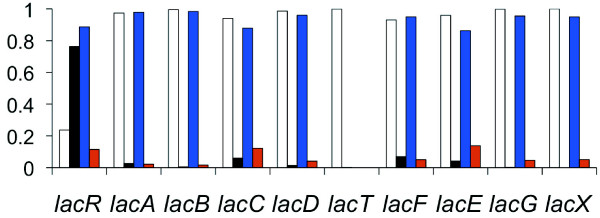
Figure 4.

Bar chart showing the relative proportion of the abundance of reads aligned to each Lac.2 gene for strains NEM316 and FSL S3-586 when grown in milk and then broth. Read abundance is the mean of the normalized count of reads for each set of replicates. Chart shows abundance as follows: white bar = proportion of reads aligned for NEM316 when grown in milk, black bar = proportion of reads aligned for NEM316 when grown in broth, blue bar = proportion of reads aligned for FSL S3-586 when grown in milk, red bar = proportion of reads aligned for FSL S3-586 when grown in broth. LacT was absent in strain FSL S3-586 (see Results and Discussion).
