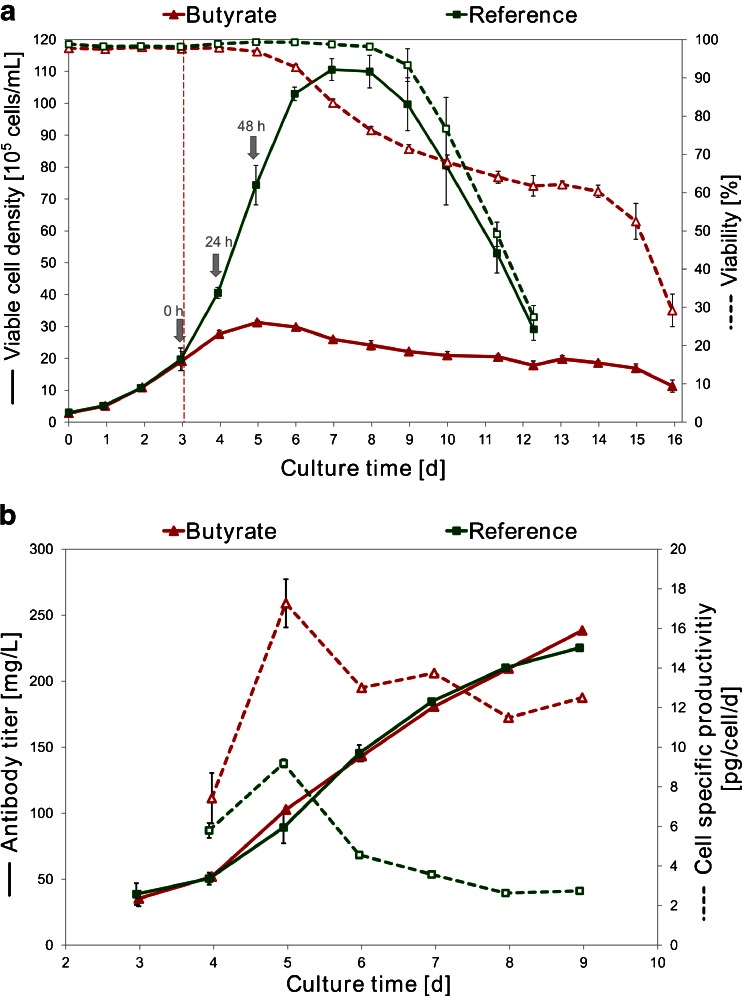
Fig. 2.
Cell growth and IgG production of butyrate-treated and control cultures. Shown are the mean values of each four replicate cultures, error bars represent standard deviations. a Mean viable cell density (continuous lines) and viability (dashed lines). Addition of 3 mM butyrate is marked by a red vertical line, sampling points for microarray analyses are marked by grey arrows. b Mean IgG titer (continuous lines) and cell specific productivity (dashed lines) of butyrate and reference cultures

