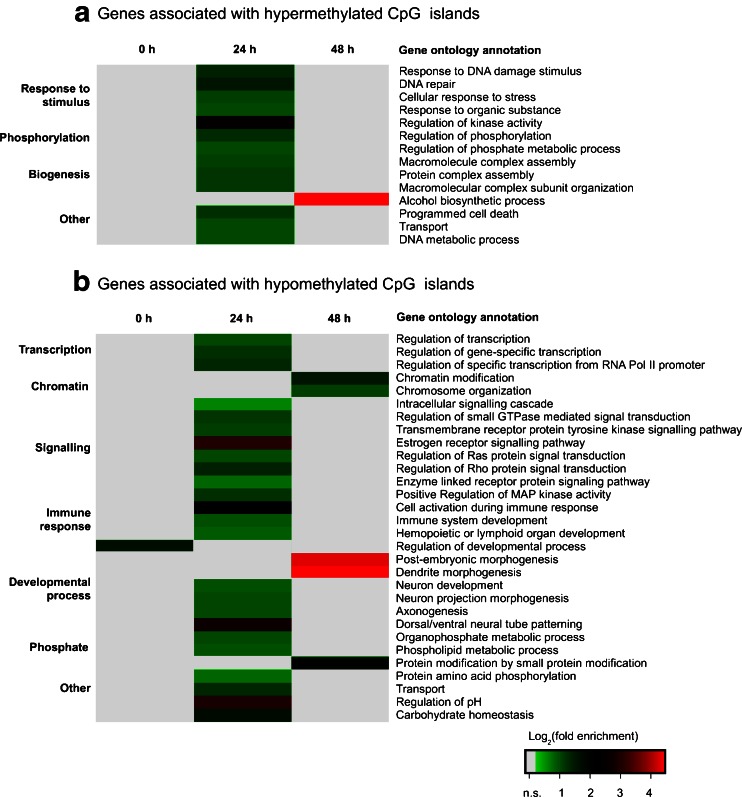
Fig. 4.
Gene ontology analysis of genes affected by butyrate-mediated differential methylation of associated CpG islands. a,b Heat maps of significantly enriched GO terms. GO analysis was carried out using DAVID with an EASE score ≤0.01. Genes detected without treatment with 3 mM butyric acid (0 h) were removed from the 24 and 48 h datasets before ontology analysis. Log2 values of fold enrichment are colour-coded according to the legend, n.s. not significantly enriched

