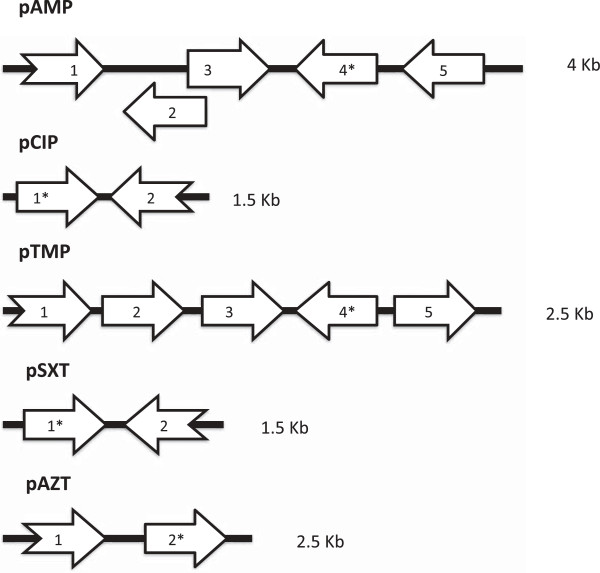
Figure 1.
Diagram of open reading frames and DNA insert size. Open reading frame labels correspond to those in Table 2. Broken arrows correspond to truncated open reading frames. Open reading frames marked with a * show similarity to known drug resistance genes. Figure not drawn to scale.

