
Figure 5.
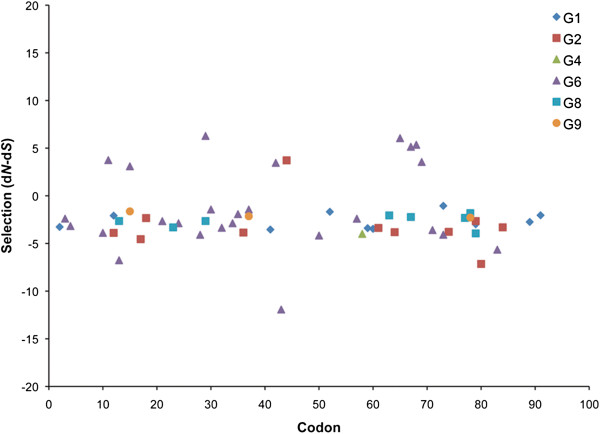
Positively and negatively selected sites of I. ricinus Kunitz transcripts. Codon-by-codon (x-axis) of the nucleotide substitution selected sites (positive or negative; y-axis) were calculated by the Datamonkey server [58] via the SLAC algorithm [59]. The graph depicts the groups that had evidence (p-value < 0.05) for selection as indicated in Table 1. Of note, G3, G7 and G11 (and simple Kunitz) were not included since they contained only two sequences.