
Figure 1.
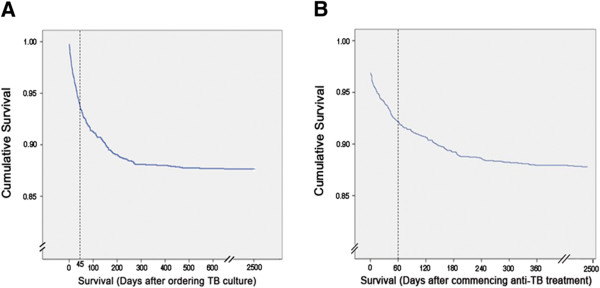
Kaplan-Meier survival curve of all TB patients. Panel A and B shows the survival curve after ordering TB culture and commencing anti-TB treatment, respectively.
Official websites use .gov
A
.gov website belongs to an official
government organization in the United States.
Secure .gov websites use HTTPS
A lock (
) or https:// means you've safely
connected to the .gov website. Share sensitive
information only on official, secure websites.
Kaplan-Meier survival curve of all TB patients. Panel A and B shows the survival curve after ordering TB culture and commencing anti-TB treatment, respectively.