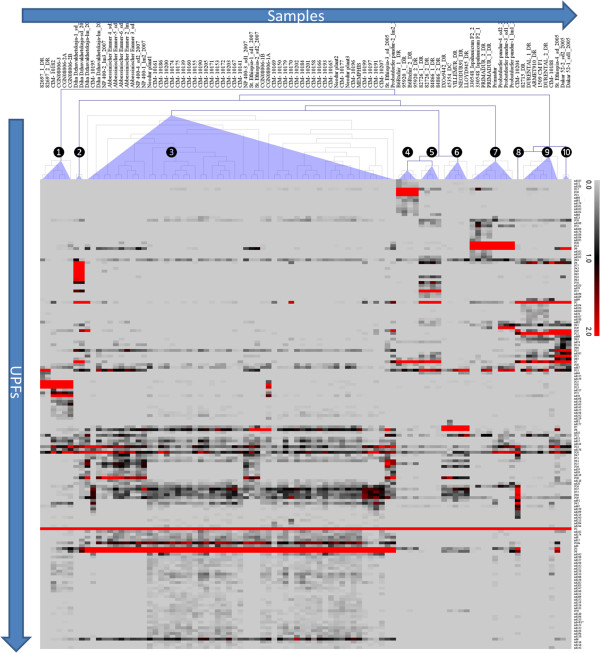
Figure 5.
Alpha-gliadin expression profiles of durum wheat plants. The deduced unique alpha-gliadin protein fragments (UPFs) were differentially present in transcripts among the samples, at normalised transcript abundances ranging from zero (light grey) to 75.48 (2487/3295, for UPF- P1). The plants were clustered based on their UPF expression profiles using hierarchical clustering (average linkage groups, Pearson correlation). Heat map: normalised transcript abundances zero = light grey; normalised transcript abundance ~1 = black; normalised transcript abundance ~1.5 to > 2 = clear red.

