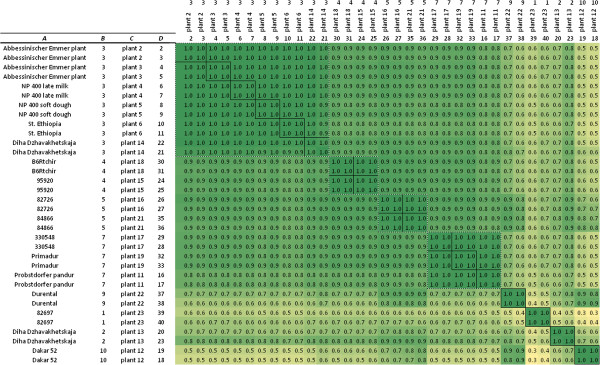
Figure 6.

Correlations matrix of expression profiles. Comparison of the alpha-gliadin expression profiles found in plants sampled from durum wheat accessions (Pearson’s r). Two cDNA samples were analysed from each plant. A = accession name; B = expression profile number; C = plant number; D = cDNA sample number.
