
Figure 7.
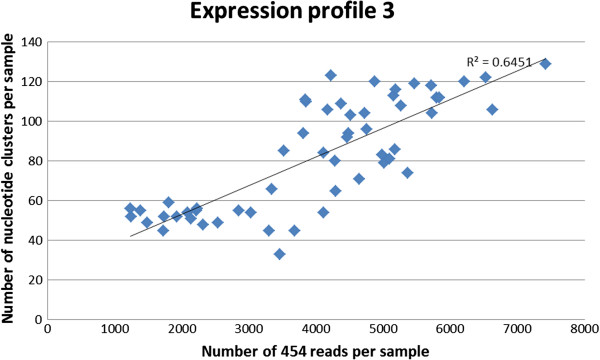
Sequence depth and number of unique alpha gliadin gene clusters. The correlation (Pearson’s r) between the sequence read depth of a sample and the number of different unique alpha-gliadin gene clusters detected in plants (n = 49) with expression profile 3.