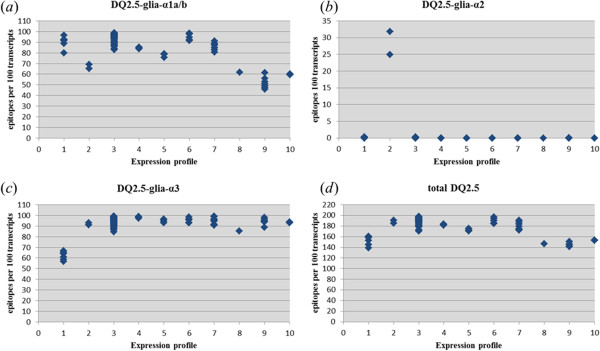
Figure 9.

CD epitope abundance in different alpha-gliadin expression profiles. Among the 77 plants ten different alpha-gliadin expression profiles are recognized (expression profile 1–10). The number of CD-epitopes per 100 transcripts is shown for each profile (profile 1 to 10) for respectively (a) DQ2.5-glia-α1a and DQ2.5-glia-α1b, (b) DQ2.5-glia-α2, (c) DQ2.5-glia-α3 and (d) the total HLADQ2.5 epitopes. Each data point is, the number per 100 transcripts for CD epitopes = ∑171 UPFs (number per UPF for a CD epitope core x normalised transcript abundances per UPF), for a single plant.
