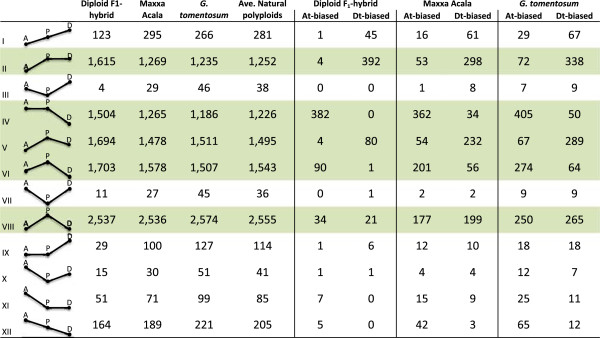
Figure 6.

Number of genes in 12 categories listed in first column where ‘A’ = expression from A genome, ‘D’ = expression level from D genome, and the ‘P’ = expression level from polyploid. The position of letters A, D and P indicate the level of expression relative to the other. Rows shaded green indicate ‘high-level expression’ of the polyploid compared to the diploids.
