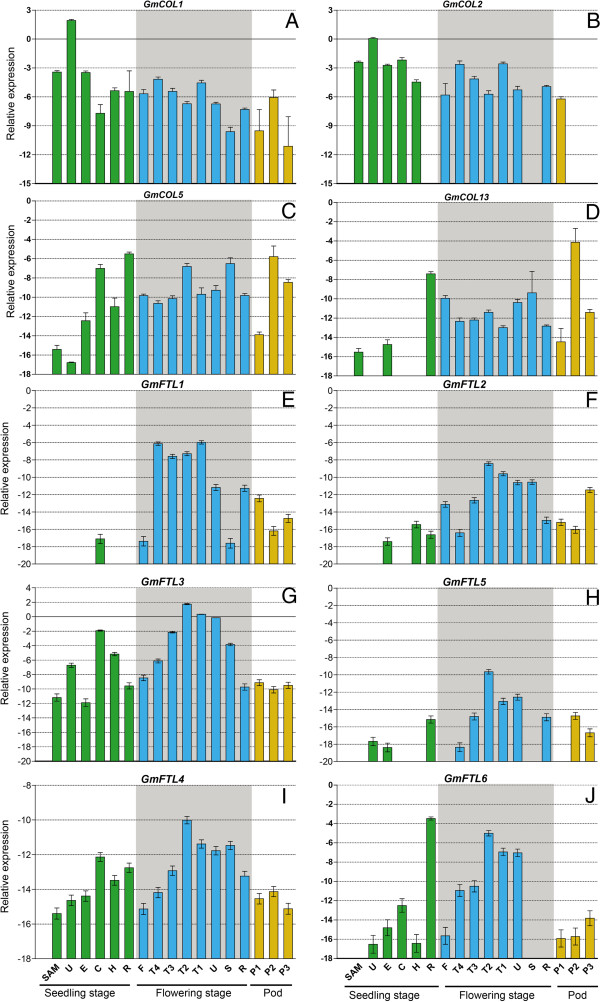
Figure 4.
Expression profiles of soybean CO or FT orthologs. A, B, C and D was expression profile of GmCOL1, 2, 5 and 13, respectively. E, F, G, H, I and J was expression profile of GmFTL1, 2, 3, 5, 4 and 6, respectively. R, root; H, hypocotyl; C, cotyledon; E, epicotyl; U, unifoliolate leaf; S, stem; T1, T2, T3, T4, the first, second, third and fourth trifoliolate leaf, respectively; F, flower; SAM, the shoot apex (including the apical meristem and immature leaves) at the seedling stage. P1, P2, and P3: seven, fourteen and twenty one days after the onset of flowering, respectively. The geometric means of GmACT11 and GmUKNI transcripts were used as the reference transcript.

