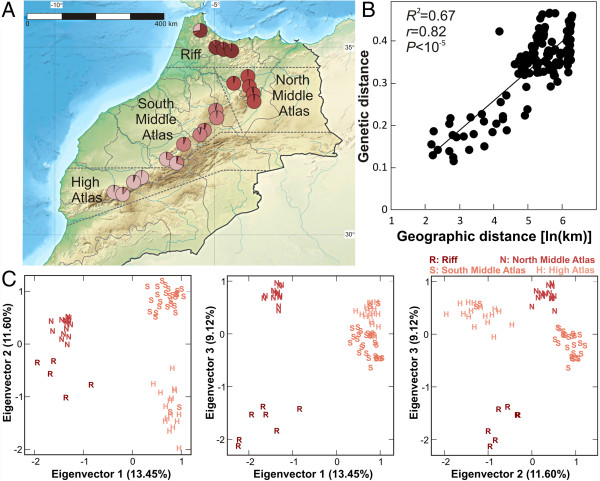
Figure 1.
Genetic and geographic structure of A. thaliana in Morocco. A) Geographic location of Moroccan populations and their genetic relationships inferred with STRUCTURE. Each population is depicted as a pie chart quantifying membership proportions for four genetic clusters (K = 4). B) Correlation between geographic and genetic distances (average proportion of allelic differences) among populations. C) Scatter plots displaying paired combinations of the first three eigenvectors estimated by PCA of Moroccan genotypes. The four main groups detected by clustering analysis of these principal components are shown with the same colors as the STRUCTURE clusters of A.

