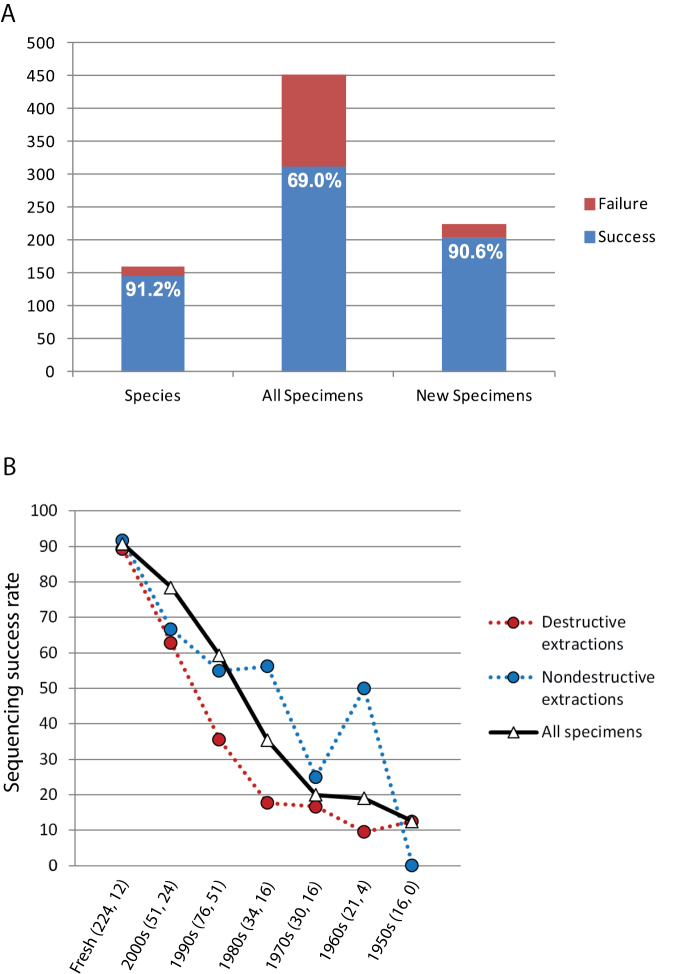
Figure 1.
A Sequencing success profile for specimens included in this study. Data are species attempted, all specimens in the study including the time series, and fresh specimens collected in 2010 or later. Success expressed as a percentage appears on the blue (success) portion of each bar B Sequencing success rates for fresh (collected 2010 or later) and older specimens grouped by decade. Data given for all extractions regardless of method, and also partitioned into destructive and nondestructive extraction methods. Total number of specimens attempted and the subset of specimens attempted using nondestructive extraction given in parentheses. Note that the relatively high success rate for nondestructive extractions of specimens from the 1960s is based on two successes out of four attempts.

