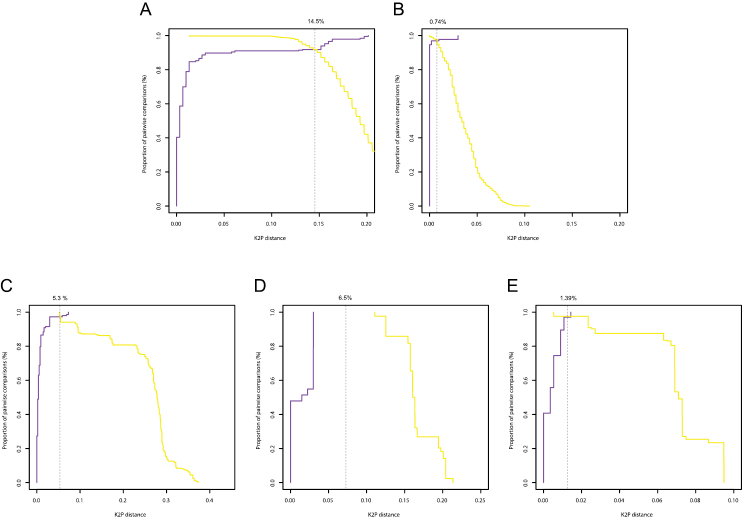
Figure 4.
Optimum threshold defined by the intersection between the cumulative frequency distribution curves of the intraspecific (purple) and the interspecific (yellow) pairwise distances for the COI gene in Diplectanidae (A), 28S rDNA region in Diplectanidae (B), the COII gene in Gyrodactylus (C), the COI gene in Gyrodactylus (D), the ITS rDNA region in Gyrodactylus (E).

