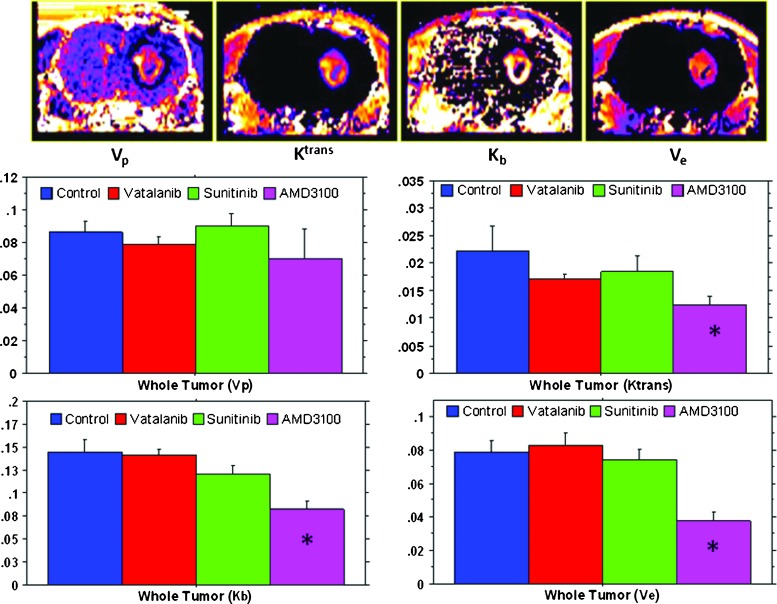
Figure 2.
MRI vascular parametric analysis after antiangiogenic therapy. The upper panel shows maps from a representative case showing tumor plasma volume (Vp), vascular forward transfer constant (Ktrans), backflow transfer constant (Kb), and interstitial space volume (Ve). The middle and lower panels show quantitative estimations of Vp, Ktrans, Kb, and Ve after the drug treatment. Note the significant decreased Ktrans, Kb, and Ve in tumors treated with AMD3100. *P < .05. All tumors were in the right hemisphere.

