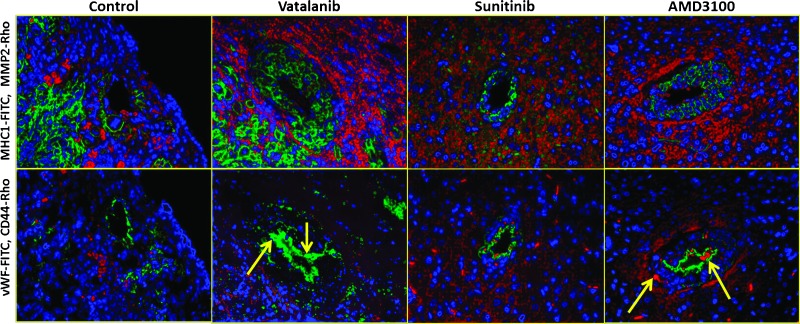
Figure 6.
Co-expression of CD44, MMP-2, and vWF in the vicinity of MHC-1-positive cells, following antiangiogenic treatment. Upper panel: Double staining with anti-MHC-1 (green) and anti-MMP-2 (red) antibodies shows correlation between the two markers of tumor invasion. Lower panel: Double staining with anti-vWF (green) and anti-CD44 (red) antibodies showed CD44-positive cells lining the vWF-positive areas, indicating possible incorporation of tumor cells into new vessels (yellow arrow).

