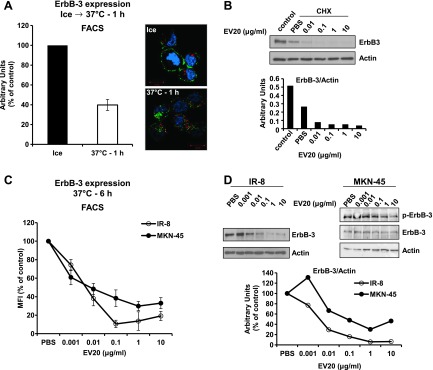
Figure 3.

EV20 induces ErbB-3 down-regulation. (A) IR-8 cells were maintained for 30 minutes on ice in the presence of 10 µg/ml EV20 and placed back at 37°C for 1 hour. ErbB-3 expression and localization were evaluated by FACS (left) and by confocal microscopy imaging (right). The histogram represents the percentage of mean fluorescence intensity (MFI) referred to control (cells maintained on ice). Plotted results are an average ± SD of three independent experiments. For confocal microscopy imaging, EV20 and the early endosome marker EEA1 were visualized in green and red, respectively. Cell nuclei are shown in blue. (B) IR-8 cells were incubated for 3 hours with 10 µg/ml CHX in the presence or absence of increasing doses of EV20. Lysates were probed with the indicated antibodies. Anti-ErbB-3 immunoreactivity was quantified and plotted after normalization for actin. (C and D) IR-8 and MKN-45 cells were exposed to increasing doses of EV20 for 6 hours and then analyzed for surface and total ErbB-3 expression by FACS (C; one representative of three independent experiments is shown) and WB (D), respectively. Anti-ErbB-3 immunoreactivity was quantified and plotted after normalization for actin. The data shown in B and D are representative of two independent experiments.
