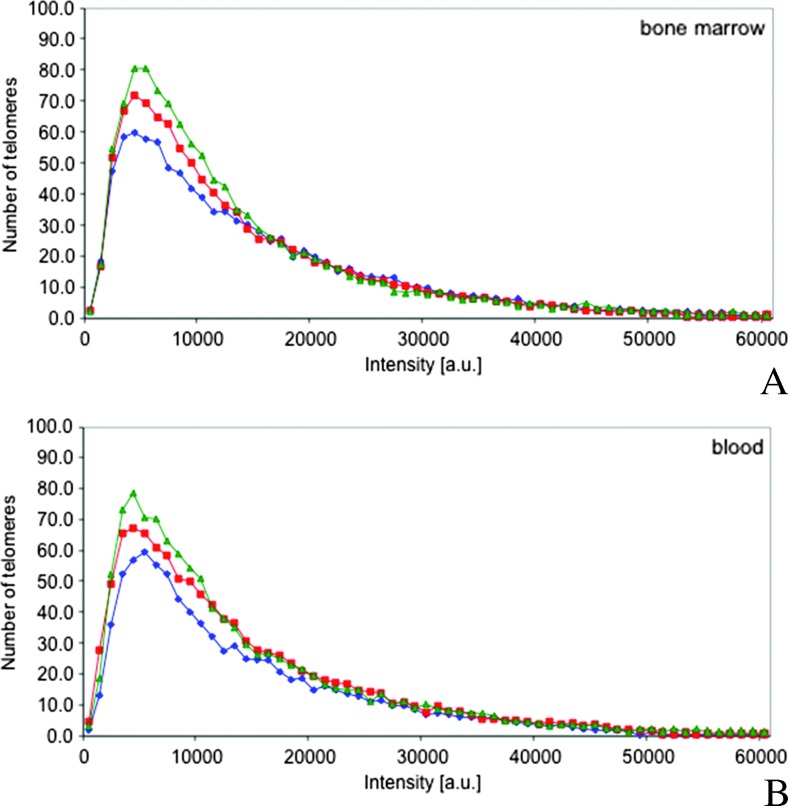
Figure 2.
Telomere intensities change with disease progression. (A and B). MGUS (blue), MM (red), and MMrel (green) show distinct profiles with respect to the telomere intensities and number of telomeres in the low-intensity range. The profiles obtained with BM aspirates (A) are identical to the profiles obtained with blood samples (B).

