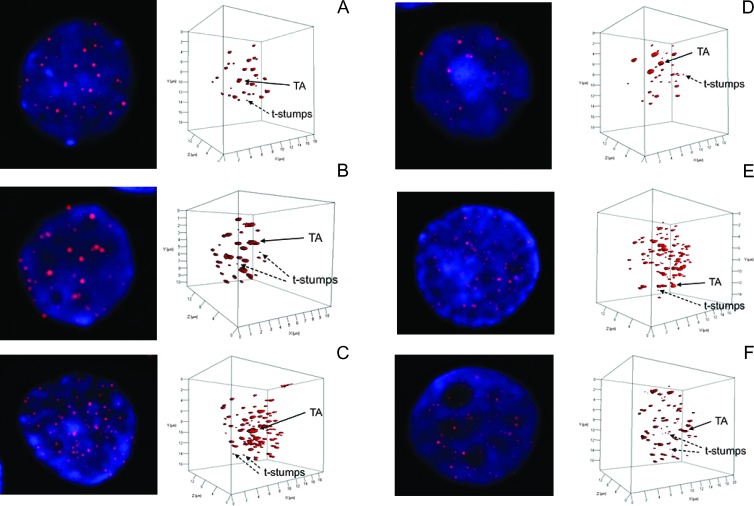
Figure 3.
Evolution of 3D nuclear architecture in blood (A–C) and BM (D–F). The left side of the panel shows the telomere distribution (red) within the counterstained nucleus (blue). During evolution, the 3D nuclear architecture is undergoing changes (right-hand panels). The number of t-stumps and TAs and the nuclear volume are increasing (see scale).

