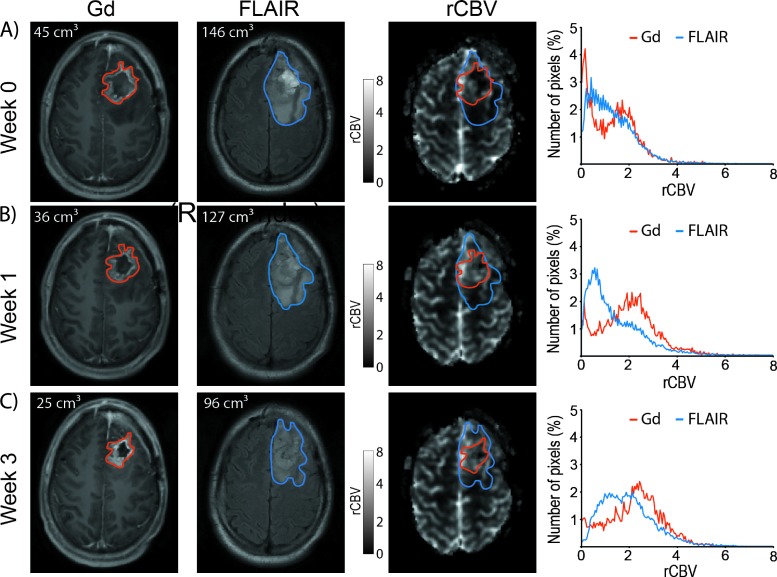
Figure 2.
Representative T1-weighted post-Gd (left), FLAIR (middle), and rCBV maps (right) of a patient with glioblastoma at -1 (A), 1 (B), and 3 weeks (C) post-treatment initiation. Red and blue contours depict post-Gd T1-weighted and FLAIR imaging tumor volumes, respectively. The tumor histogramfor rCBV is depicted using either Gd-VOI (red curves) or FLAIR-VOI (blue curves) obtained-1 (A), 1 (B), or 3 weeks (C) after treatment initiation.

