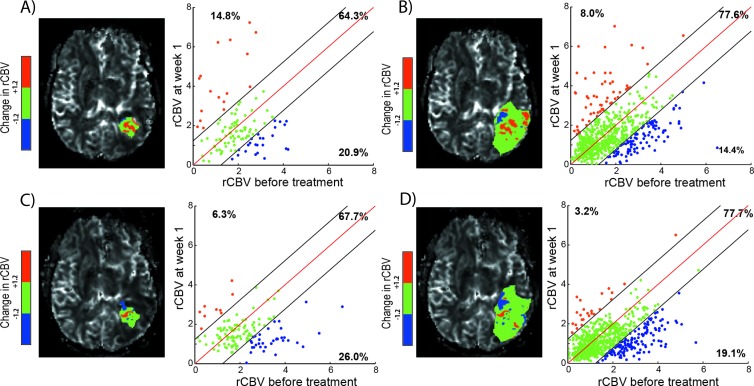
Figure 4.
PRMrCBV of a patient nonresponsive to therapy with an overall survival of 2.9 months. Representative slice of PRMrCBV color-coded VOI (A, C: Gd-VOI and B, D: FLAIR-VOI) superimposed onto an rCBV map (left) and the corresponding quantitative scatterplot analysis (right) showing the distribution or rCBV at baseline compared with mid-time treatment (A, B: week 1 and C, D: week 3). For each scatterplot, the values of PRMrCBV+, PRMrCBV0, and PRMrCBV- of this patient (corresponding to the relative tumor volume of red, green, and blue voxel pairs plotted as dots, respectively) are presented.

